A complete list of all papers by Bill Dupor is available here.
Recently Accepted and Published
Regional Consumption Responses and the Aggregate Fiscal Multiplier
Co-authored with Marios Karabarbounis (FRB of Richmond), Marianna Kudlyak (FRB of San Francisco) and M. Saif Mehkari (University of Richmond)
Accepted for publication: Review of Economic Studies.
Accepted for publication: Review of Economic Studies.
The Aggregate and Local Economic Effects of Government Financed Health Care
Co-authored with Rodrigo Guerrero (Yale University).
Economic Inquiry, 2021, Vol. 59, 662-670.
Government-financed health care expenditures, through Medicare and Medicaid, have grown from roughly 0% to over 7.6% of national personal income over the past 50 years. This paper investigates the stimulative effects of Medicare spending. Using an annual, state-level panel, we regress state income growth on own-state spending and spending in other states, instrumented by unanticipated shocks to aggregate Medicare spending, to estimate local and spillover effects. In our benchmark specification, the own-spending multiplier equals 1.3 and the spillover multiplier equals 0.4. The total Medicare spending multiplier (i.e., local plus spillover) is approximately 1.7.
A Cup Runneth Over: Fiscal Policy Spillovers from the 2009 Recovery Act
Co-authored with Peter B. McCrory (J.P. Morgan Chase).
The Economic Journal, June 2018, Vol. 128, Issue 611, 1476-1508; Data used in paper; Online appendix.
Click here for penultimate (but publicly available) version.
Abstract. This paper studies the effects of interregional spillovers from the government spending component of the American Recovery and Reinvestment Act of 2009 (the Recovery Act). Using cross-county Census Journey to Work commuting data, we cluster U.S. counties into local labor markets, each of which we further partition into two subregions. We then compare differential labor market outcomes and Recovery Act spending at the regional and subregional levels using instrumental variables. Our instrument is the sum of spending by federal agencies not instructed to allocate Recovery Act funds according to the severity of local downturns. Among pairs of subregions, we find evidence of fiscal policy spillovers. According to our benchmark specification, $1 of Recovery Act spending in a subregion increases its own wage bill by $0.64 and increases the wage bill in its neighboring subregion by $0.50 during the first two years following the act's passage. We find similar spillover effects when we replace the wage bill with employment as our measure of economic activity. The spillover effect occurs in the service sector, whereas the direct effect occurs in both the services and goods producing sector
Local and Aggregate Fiscal Policy Multipliers
Co-authored with Rodrigo Guerrero (Yale University)
Journal of Monetary Economics, Dec. 2017, Vol. 92, pp. 16-30. Data used in paper; Online appendix.
Click here for penultimate (but publicly available) version.
Abstract. Using a newly constructed panel of state-level defense contracts, this paper studies the effect of defense spending on the U.S. macroeconomy. Summing observations across states, we estimate aggregate income and employment multipliers. Comparing these to local multipliers estimated with the panel provides evidence that local multiplier estimates may be reliable indicators of fiscal policy's aggregate effects. Furthermore, evidence of small positive spillovers is found. Across several speci cations, we estimate income and employment multipliers between zero and 0.5. This result is reconciled with the greater-than-one multipliers found in Nakamura and Steinsson (2014) by analyzing the Korean War years' impact on the
estimation.
So, Why Didn't the 2009 Recovery Act Improve the Nation's Highways and Bridges?
Federal Reserve Bank of St Louis Review, Second Quarter 2017, 99(2), pp. 169-182.
Abstract. Although the American Recovery and Reinvestment Act of 2009 (the Recovery Act) provided nearly $28 billion to state governments for improving U.S. highways, the highway system saw no significant improvement. For example, relative to the years before the act, the number of structurally deficient or functionally obsolete bridges was nearly unchanged, the number of workers on highway and bridge construction did not significantly increase, and the annual value of construction put in place for public highways barely budged. The author shows that as states spent Recovery Act highway grants, many simultaneously slashed their own contributions to highway infrastructure, freeing up state dollars for other uses. Next, using a cross-sectional analysis of state highway spending, the author shows that a state’s receipt of Recovery Act highway dollars had no statistically significant causal impact on that state’s total highway spending. Thus, the amount of actual highway infrastructure investment following the act’s passage was likely very similar to that under a no-stimulus counterfactual.
Abstract. Although the American Recovery and Reinvestment Act of 2009 (the Recovery Act) provided nearly $28 billion to state governments for improving U.S. highways, the highway system saw no significant improvement. For example, relative to the years before the act, the number of structurally deficient or functionally obsolete bridges was nearly unchanged, the number of workers on highway and bridge construction did not significantly increase, and the annual value of construction put in place for public highways barely budged. The author shows that as states spent Recovery Act highway grants, many simultaneously slashed their own contributions to highway infrastructure, freeing up state dollars for other uses. Next, using a cross-sectional analysis of state highway spending, the author shows that a state’s receipt of Recovery Act highway dollars had no statistically significant causal impact on that state’s total highway spending. Thus, the amount of actual highway infrastructure investment following the act’s passage was likely very similar to that under a no-stimulus counterfactual.
The 2009 Recovery Act: Stimulus at the Extensive and Intensive Labor Margins
Co-authored with M. Saif Mehkari (University of Richmond)
European Economic Review 85, (2016), pp. 208-228. Click here for penultimate (but publicly available) version.
Abstract. This paper studies the effect of government stimulus spending on a novel aspect of the labor market: the differential impact of spending on the total wage bill versus employment. We analyze the 2009 Recovery Act via instrumental variables using a new instrument, the spending done by federal agencies that were not instructed to target funds towards harder hit regions. We find a moderate positive effect on jobs created/saved (i.e., the "extensive margin") and also a significant increase in wage payments to workers whose job status was safe without Recovery Act funds (i.e., the "intensive margin"). Our point estimates imply that roughly one-half of the wage payments resulting from the act were paid at the intensive margin. To provide a theoretical underpinning for the estimates, we build a micro-founded dynamic model in which a firm meets new government demand with a combination of new hiring and increasing existing workers' average hours. Faced with hiring costs and an overtime premium, the firm responds by increasing hours along both margins. Our model analysis also provides insight into how government spending policy should be structured to lower the cost of generating new jobs. Finally, we catalogue survey evidence from Recovery Act fund recipients that reinforces the importance of the intensive labor margin.
The Expected Inflation Channel of Government Spending in the Postwar U.S.
Co-authored with Rong Li (Renmin University).
European Economic Review 74, (2015), pp. 36-56. Click here for penultimate (but publicly available) version.
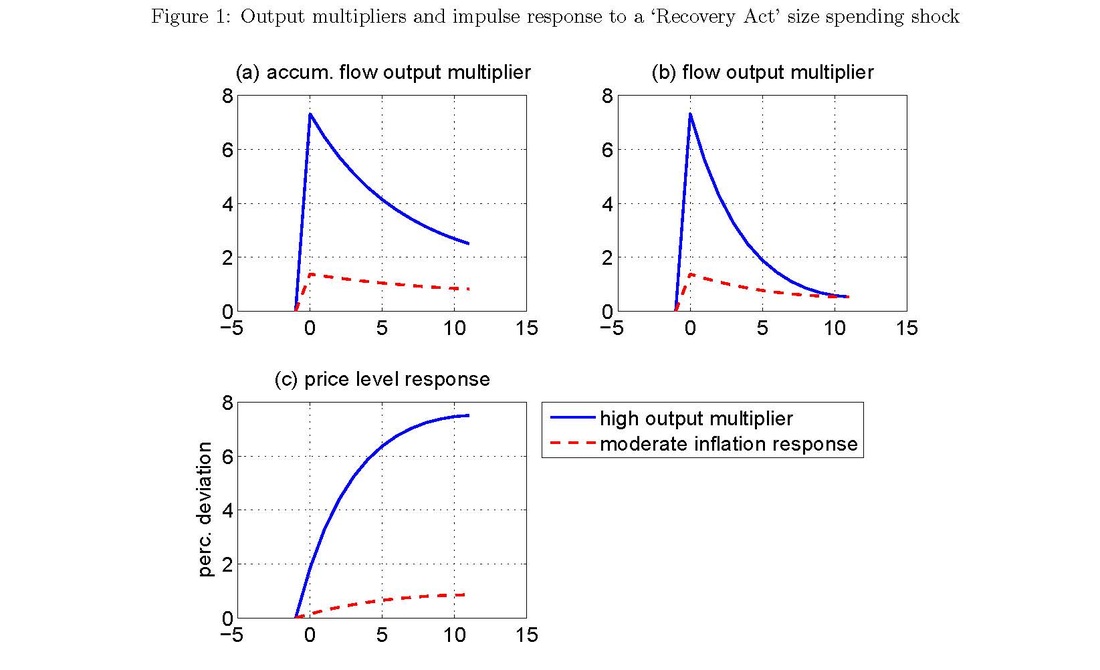
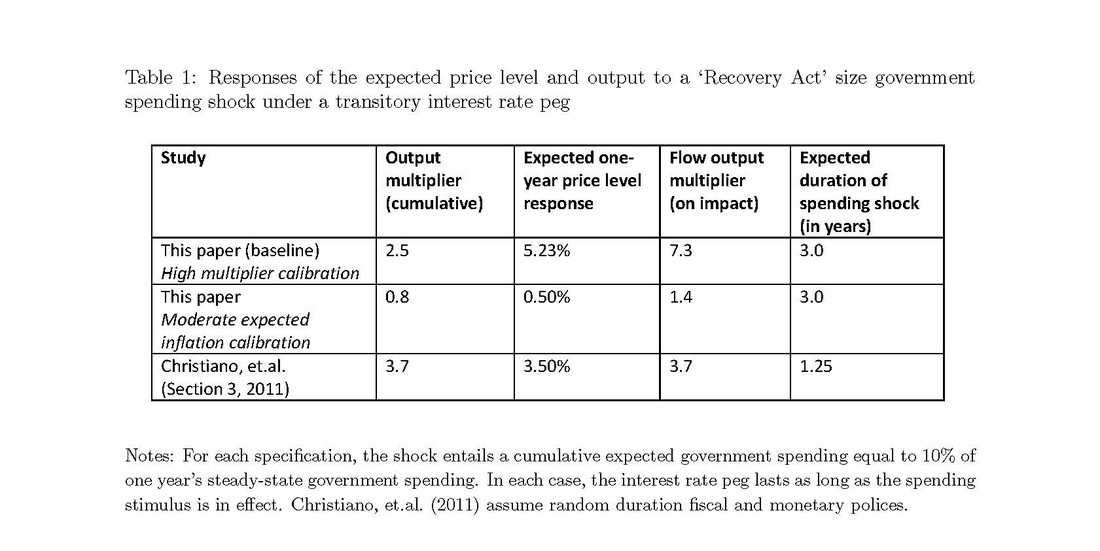
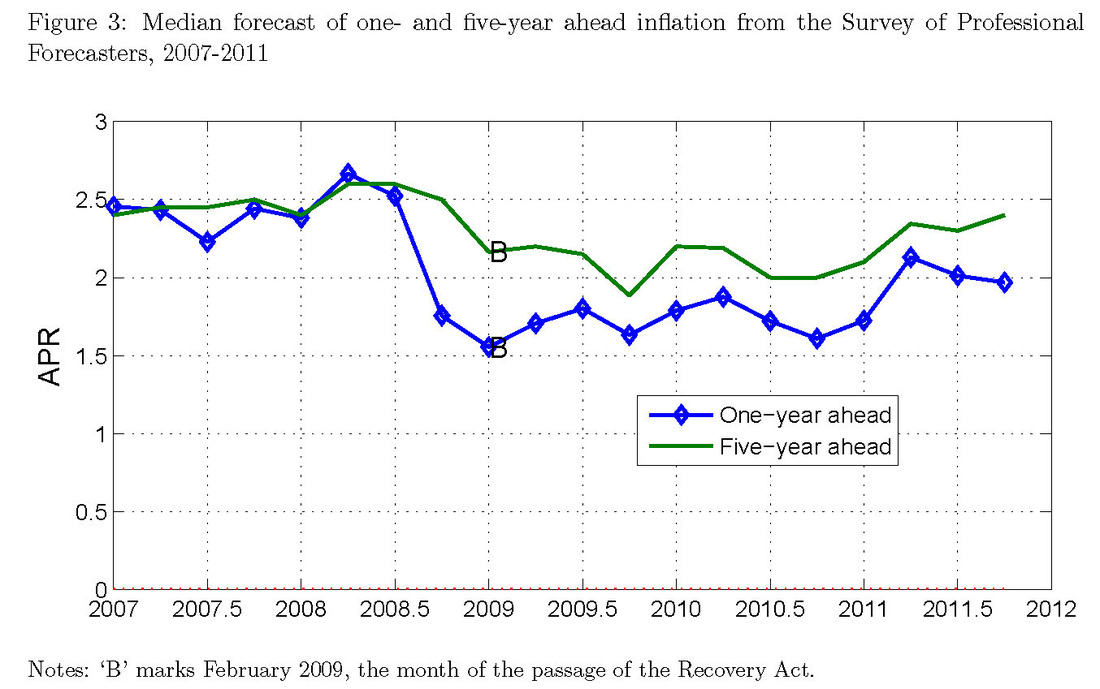
Abstract. There exist sticky price models in which the output response to a government spending change can be large if the central bank is nonresponsive to inflation. According to this "expected inflation channel," government spending drives up expected inflation, which in turn, reduces the real interest rate and leads to an increase in private consumption. This paper examines whether the channel was important in the post-WWII U.S., with particular attention to the 2009 Recovery Act period. First, we show that a model calibrated to have a large output multiplier requires a large response of expected inflation to a government spending shock. Next, we show that this large response is inconsistent with structural vector autoregression evidence from the Federal Reserve's passive policy period (1959-1979). Then, we study expected inflation measures during the Recovery Act period in conjunction with a panel of professional forecaster surveys, a cross-country comparison of bond yields and fiscal policy news announcements. We show that the expected inflation response was too small to engender a large output multiplier.
European Economic Review 74, (2015), pp. 36-56. Click here for penultimate (but publicly available) version.
Abstract. There exist sticky price models in which the output response to a government spending change can be large if the central bank is nonresponsive to inflation. According to this "expected inflation channel," government spending drives up expected inflation, which in turn, reduces the real interest rate and leads to an increase in private consumption. This paper examines whether the channel was important in the post-WWII U.S., with particular attention to the 2009 Recovery Act period. First, we show that a model calibrated to have a large output multiplier requires a large response of expected inflation to a government spending shock. Next, we show that this large response is inconsistent with structural vector autoregression evidence from the Federal Reserve's passive policy period (1959-1979). Then, we study expected inflation measures during the Recovery Act period in conjunction with a panel of professional forecaster surveys, a cross-country comparison of bond yields and fiscal policy news announcements. We show that the expected inflation response was too small to engender a large output multiplier.
For a thoughtful discussion of the paper by John Cochrane, see his post on his weblog The Grumpy Economist, linked here.
A few highlights from the paper (click on each image to see a larger version):
Recent Working Papers
Decomposing the Government Transfer Multiplier
Co-authored with Timothy Conley (Western University), Rong Li (Renmin University of China) and Yijiang Zhou (Chinese University of Hong Kong)
Working paper. July 2023.
We estimate the local, spillover and aggregate causal effects of government transfers on personal income. We identify exogenous changes in federal transfers to residents at the state-level using legislated social security cost-of-living adjustments between 1952 and 1974. Each effect is measured as a multiplier: the change in personal income in response to a one unit change in transfers. The local multiplier, i.e., the effect of own-state transfers on own-state income holding fixed other state's income, at a four-quarter horizon is approximately 3.4. The cross-state spillover multiplier is about -0.7, but not statistically different from zero. The aggregate multiplier, i.e., the sum of its local and spillover components, equals 2.7. More generally, our paper provides a template for conducting inference that decomposes an aggregate effect into its local and spillover components.
The Sine Aggregatio Approach to Applied Macro
Co-authored with Timothy Conley (Western University) and Mahdi Ebsim (New York University)
Working paper. This draft. November 2022
We develop a method to use disaggregate data to conduct causal inference in macroeconomics. The approach permits one to infer the aggregate effect of a macro treatment using regional outcome data and a valid instrument. We estimate a macro effect without (sine) the aggregation (aggregatio) of the outcome variable. We exploit cross-equation parameter restrictions to increase precision relative to traditional, aggregate series estimates and provide a method to assess robustness to departures from these restrictions. We illustrate our method via estimating the jobs effect of oil price changes using regional manufacturing employment data and an aggregate oil supply shock.
The Jobs Effect of Ending Pandemic Unemployment Benefits: A State-Level Analysis
Co-authored with Iris Arbogast (Federal Reserve Bank of St. Louis)
Working paper. This draft. September 2022.
This paper uses the asynchronous cessation of emergency unemployment benefits (EUB) in 2021 to investigate the jobs impact of ending unemployment benefits. While some states stopped providing EUB in September, others stopped as early as June. Using the cessation month as an instrument, we estimate the causal effect on employment of reducing unemployment rolls. In the first two months following a state’s program termination, for every 100 person reduction in beneficiaries, state employment causally increased by about 26 persons. The effect is statistically different from zero and robust to a wide array of alternative specifications.
The 2008 U.S. Auto Market Collapse
Co-authored with Rong Li (Renmin Univ.), M. Saif Mehkari (Univ. of Richmond) and Yi-Chan Tsai (National Taiwan University)
Working paper. This draft: January 2020.
New vehicle sales in the U.S. fell nearly 40 percent during the past recession, causing significant job losses and
unprecedented government interventions in the auto industry. This paper explores three potential explanations for this decline: increasing oil prices, falling home values, and falling household income expectations. First, we use the historical macroeconomic relationship between oil prices and vehicle sales to show that the oil price spike explains roughly 15
percent of the auto sales decline between 2007 and 2009. Second, we establish that declining home values explain only a small portion of the observed reduction in household new vehicle sales. Using a county-level panel from the episode, we find (1) a one-dollar fall in home values reduced household new vehicle spending by 0.5 to 0.7 cents and overall new vehicle
spending by 0.9 to 1.2 cents and (2) falling home values explain between 16 and 19 percent of the overall new vehicle spending decline. Next, examining state-level data for 1997-2016, we find (3) the short-run responses of new vehicle consumption to home value changes are larger in the 2005-2011 period relative to other years, but at longer horizons (e.g. 5 years), the responses are similar across the two sub-periods and (4) the service flow from vehicles, as measured by miles traveled, responds very little to house price shocks. We also detail the sources of the differences between our findings (1) and (2) from existing research. Third, we establish that declining current and expected future income expectations potentially played an important role in the auto market's collapse. We build a permanent income model augmented to include infrequent repeated car buying. Our calibrated model matches the pre-recession distribution of auto vintages and the
liquid-wealth-to-income ratio, and exhibits a large vehicle sales decline in response to a mild decline in expected permanent income due to a transitory slowdown in income growth. In response to the shock, households delay replacing existing vehicles, allowing them to smooth the effects of the income shock without significantly adjusting the service flow from their vehicles. Augmenting our model with a richer set of household expectations allows us to match 65 percent of the overall new vehicle spending decline (i.e. roughly the portion of the decline not explained by oil prices and falling home values). Combining our negative results regarding housing wealth and oil prices with our positive model-based findings, we interpret
the auto market collapse as consistent with existing permanent income based approaches to durable goods purchases (e.g., Leahy and Zeira (2005)).
Additional Research on the 2009 Recovery Act
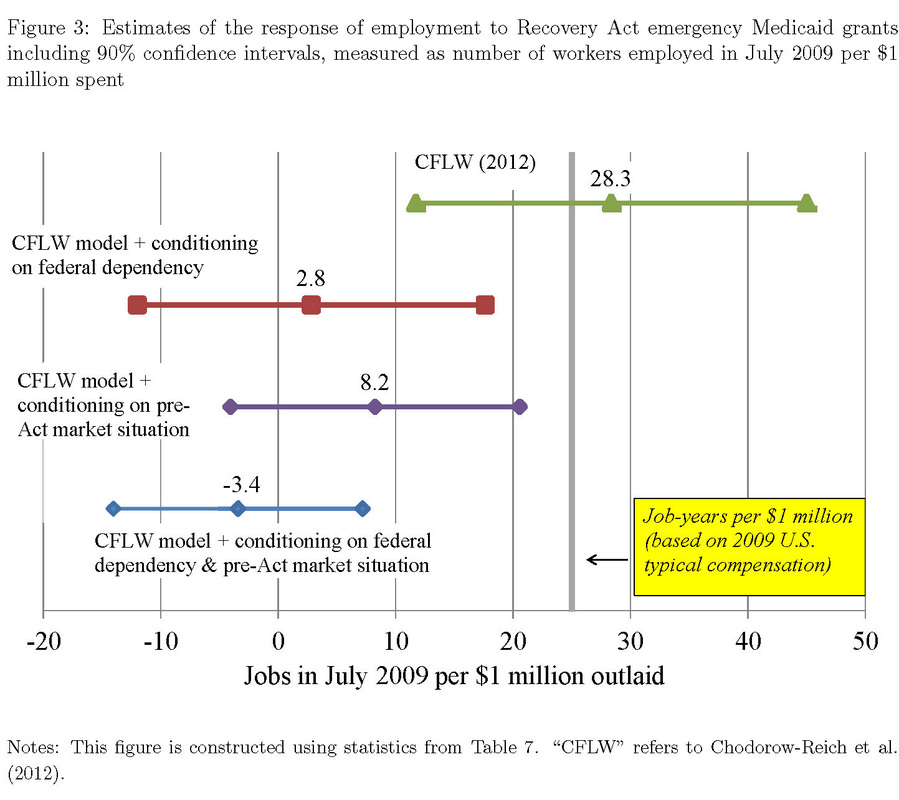
Creating Jobs Via the 2009 Recovery Act: State Medicaid Grants Compared to Broadly-Directed Spending
Working paper. This draft: November 2013. First draft: May 2013.
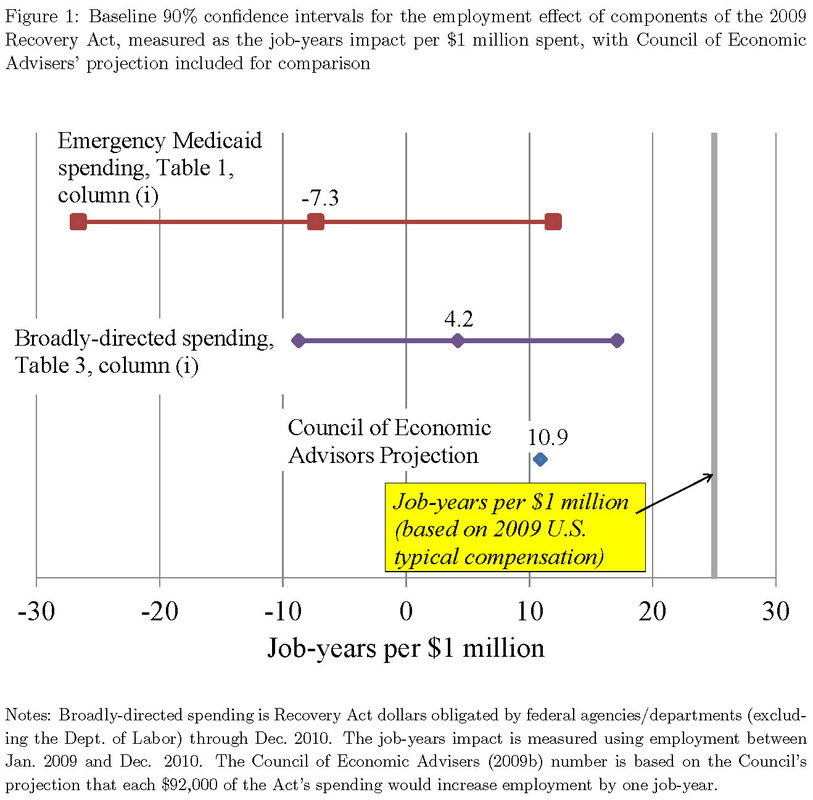
Abstract. Researchers have used cross-state differences to assess the jobs impact of the 2009 American Recovery and Reinvestment Act (the Recovery Act). Existing studies find that the Act's broadly-directed spending (i.e. excluding tax cuts) increased employment, at a cost-per-job of roughly three to five times that of typical employment compensation in the U.S. Other research finds that a particular component of the Act---emergency Medicaid grants to states---created jobs at a cost of 12% to 20% that of broadly-directed spending. This paper shows that these differences across the components' impacts can be explained by omitted variables in the existing work on the emergency Medicaid grants. Adjusting for the omissions, the jobs effect of the Act's Medicaid grants becomes substantially weaker. The omissions are: (i) not controlling the degree of (non-Recovery Act) federal dependency, (ii) not duly controlling for pre-Act housing and labor market conditions, and (iii) not conditioning on Recovery Act funding beyond that from the Act's Medicaid grants. Adjusting for any one of these omissions, by itself, results in a substantial increase in the cost of job creation and/or no statistically significant jobs effect.
Abstract. Researchers have used cross-state differences to assess the jobs impact of the 2009 American Recovery and Reinvestment Act (the Recovery Act). Existing studies find that the Act's broadly-directed spending (i.e. excluding tax cuts) increased employment, at a cost-per-job of roughly three to five times that of typical employment compensation in the U.S. Other research finds that a particular component of the Act---emergency Medicaid grants to states---created jobs at a cost of 12% to 20% that of broadly-directed spending. This paper shows that these differences across the components' impacts can be explained by omitted variables in the existing work on the emergency Medicaid grants. Adjusting for the omissions, the jobs effect of the Act's Medicaid grants becomes substantially weaker. The omissions are: (i) not controlling the degree of (non-Recovery Act) federal dependency, (ii) not duly controlling for pre-Act housing and labor market conditions, and (iii) not conditioning on Recovery Act funding beyond that from the Act's Medicaid grants. Adjusting for any one of these omissions, by itself, results in a substantial increase in the cost of job creation and/or no statistically significant jobs effect.
Comments on "Are State Governments Roadblocks to Federal Stimulus? Evidence on the Flypaper Effect from Highway Grants in the 2009 Recovery Act"
Co-authored with Rodrigo Guerrero (Federal Reserve Bank of St. Louis)
Working paper. May 2017.
Working paper. May 2017.
The content of this site does not reflect the views of the Federal Reserve Bank of St. Louis or the Federal Reserve System.
